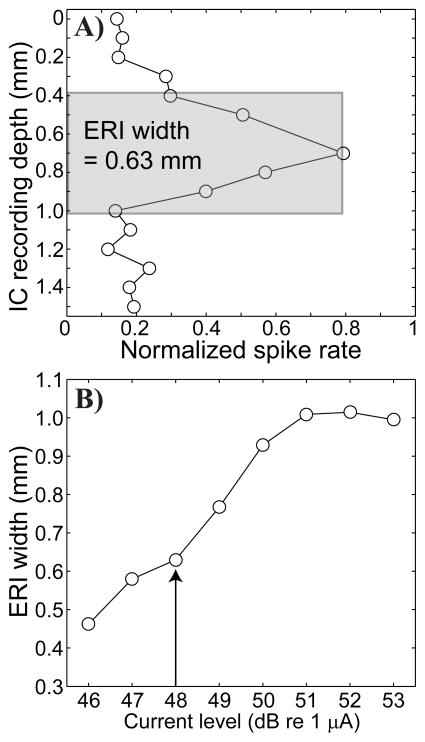
Figure 2.
Single-pulse ICC image and equivalent rectangular (ERI) widths. A) This panel shows the distribution of normalized spike activity (abscissa) as a function recording depth in the ICC (ordinate). Data are from cochlear implant channel 6, using a stimulus level of 2 dB above threshold with a partial tripolar fraction of 1.0 in GP5. The grey shading indicates the equivalent rectangular image (ERI): a rectangle that is equivalent to the area under the image curve with the same height as the curve. The width of the ERI, 0.63 mm in this case, provides a measure of spread of activation. B) This panel shows ERI width (ordinate in mm) as a function of stimulus current level (dB re 1 μA). The vertical arrow indicates the ERI for 2 dB above threshold.

