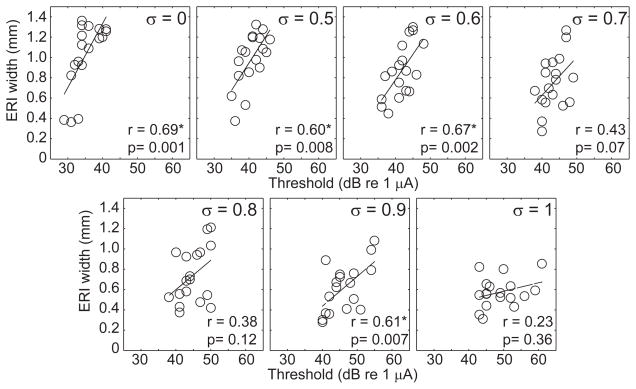
Fig. 4.
Relation of ERI and neural thresholds. ERI (ordinate) is plotted as a function of threshold (abscissa) for all of the partial tripolar fractions tested: from 0 (top left) to 1 (bottom right). Data from the three tested stimulus channels for each subject are plotted and included in the correlation analyses. Linear regressions are indicated by the solid lines.

