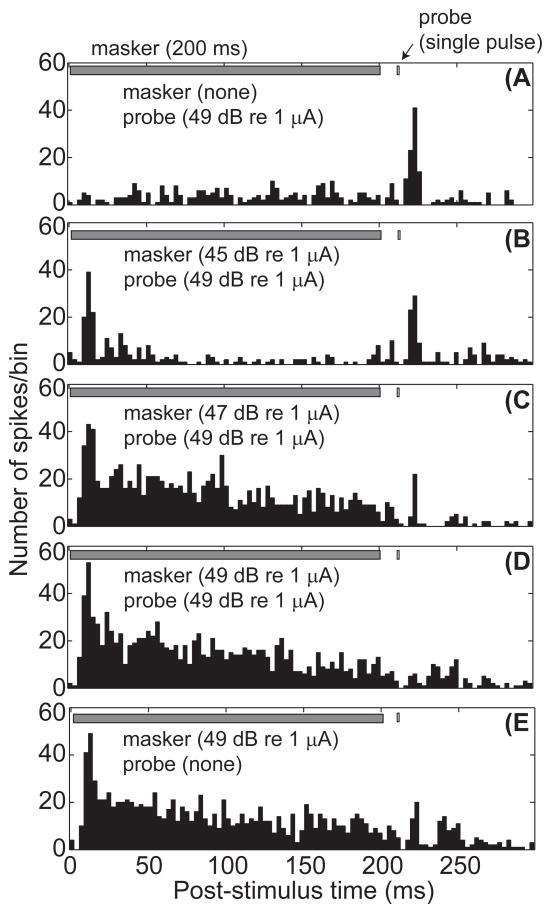
Figure 5.
Post-stimulus time histograms for forward masking stimuli. Each panel represents the post-stimulus time histogram for a given set of masker levels, with or without the fixed-level probe stimulus. The probe level was fixed at 49 dB re 1 μA, approximately 4 dB above the threshold for the probe alone. The average number of spikes per time bin (ordinate) is plotted as a function of post-stimulus time in ms (abscissa). Fig. 5a shows the response to the single pulse probe stimulus (A) with no masker present. Fig. 5b shows the response to a low level masker and the fixed level probe stimulus. Fig. 5c shows the response to a medium level masker and the fixed probe. Fig. 5d shows the response to a high level masker and the fixed probe. Fig. 5e shows the response to the high level masker with no probe stimulus. Responses are from GP5, with masker channel 6 at δ = 0.5 and probe channel 6 at δ = 1.

