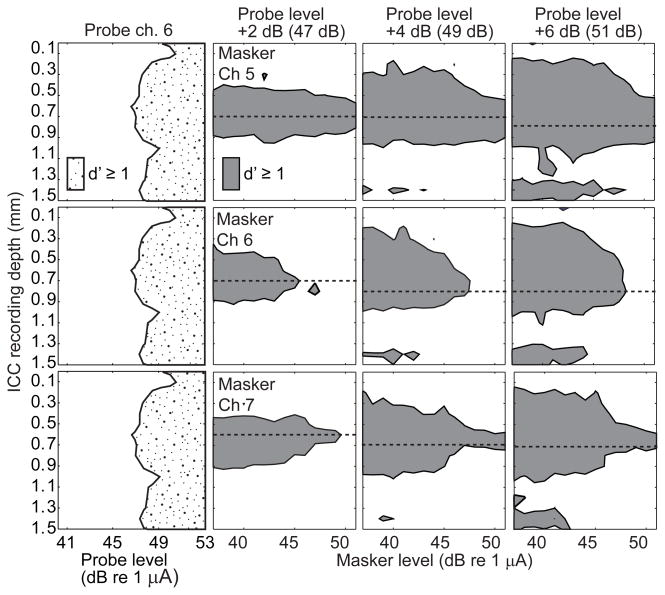
Figure 6.
Forward masking spatial tuning curves with a tripolar probe. The left column of panels shows the neural response to the probe stimulus alone, with recording depth (ordinate) as a function of increasing probe level (abscissa). The remaining panels each show the neural response to the probe as a function of masker levels. The shaded area represents the range of ICC depths at which there was a detectable response to the probe across a range of masker levels at a criterion of d′=1. Areas to the right of the shaded area at each depth correspond to masker levels at which the probe was masked to below detectability. For all conditions the masker tripolar fraction was fixed at 0.5 and the probe had a tripolar fraction of one and was presented on channel 6. Within a column of panels the probe level is fixed as indicated at the top of each column. Within a row of panels the masker channel is fixed as indicated in the left panels. The horizontal dashed line in each panel indicates the recording site that was most sensitive to the masker and was used to calculate the forward masked profiles. Data are from GP5.

