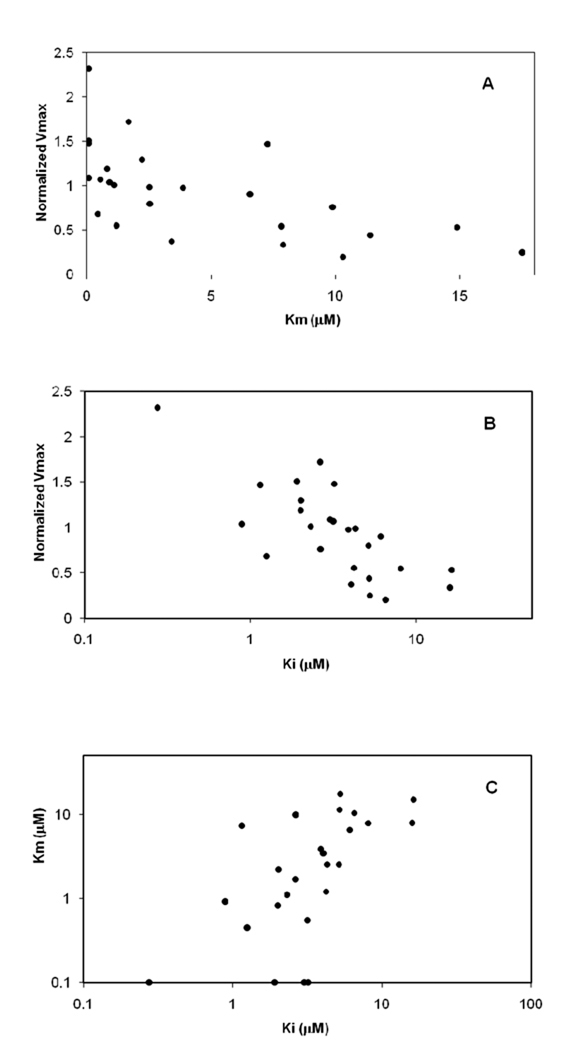
Figure 3.
Plotted relationships between substrate and inhibition parameters for conjugates 1–25 (i.e. Set 1). (A) The relationship between normalized Vmax and Km is plotted. Compounds with higher affinity (i.e. lower Km) were associated with higher capacity. (B) The relationship between Km and Ki is plotted. Substrate affinity and inhibitory potency were generally similar, implicating binding as the rate limiting step in overall conjugate translocation. (C) The relationship between normalized Vmax and Ki is plotted. Inhibitor potency and capacity for each conjugate were generally positively associated, as lower Ki (i.e. higher binding) was associated with higher translocation capacity. The trend between Ki and normalized Vmax was similar to the trend between Km and normalized Vmax in panel A.

