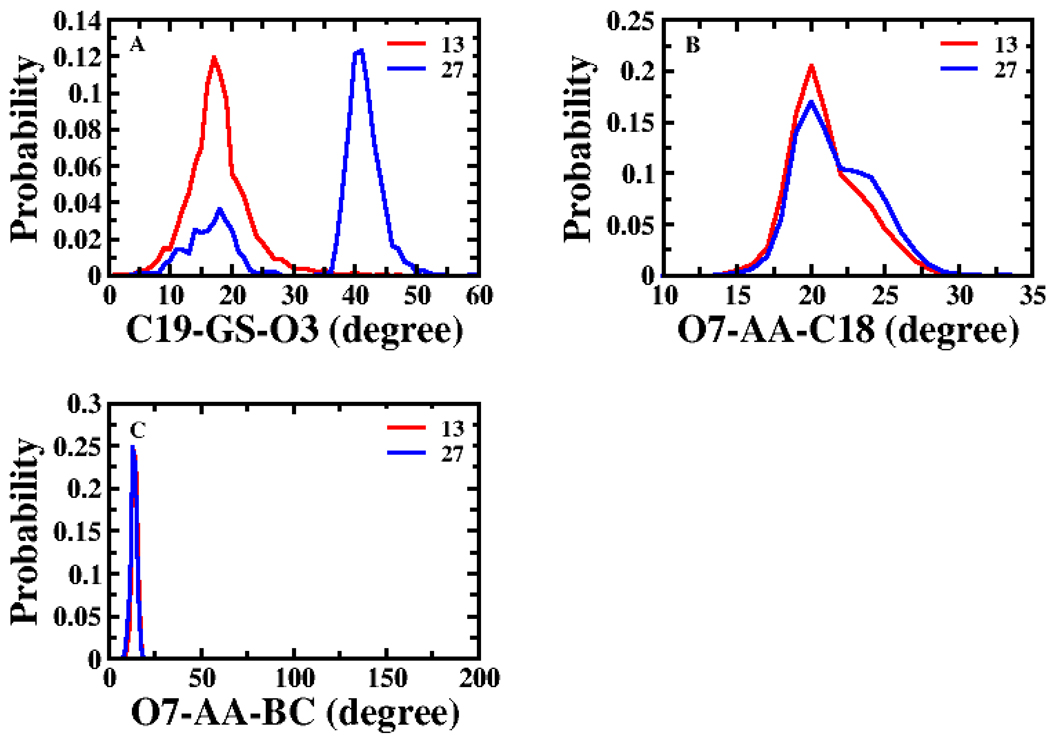
Figure 4.
Probability distributions of structural descriptors for Km modeling of Set 1. (A) Angle C19-GS-O3 and (B) angle O7-AA-C18 displayed the two highest single variable correlations amongst all structural descriptors. (C) Angle O7-AA-BC represents spatial orientation of 7-OH, α-acid and the steroidal nucleus. The red line represents the distribution of 13 (most potent substrate of all compounds) and the blue line for 27 (weakest substrate in Set 1). Panels B and C depict the conformational distributions of the topological descriptors in the top two multivariable CSP-SAR models for Set 1.

