
Figure 1.
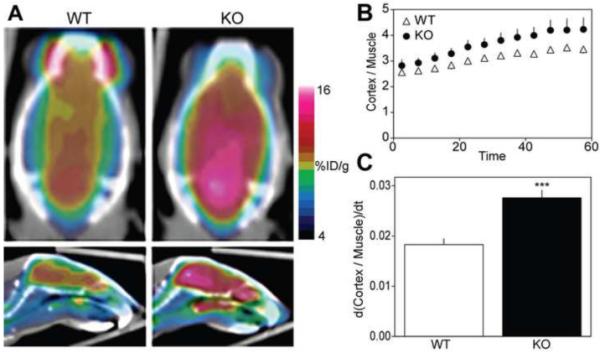
P35 knockout results in increased rate of cortical glucose uptake. (A)Representative coronal and sagittal positron emission tomography images of global brain glucose metabolism in control and p35−/− mice. Images represent the average values of a 60 min dynamic scan conducted after administration of 2-deoxy-2-[18F]fluoro-D-glucose (FDG). The color scale for each image is proportional to the percent Injected dose per gram (%ID/g) within the animal: white represents the highest, and red, yellow, green, and blue represent sequentially lower concentrations. (B) Time course of FDG uptake in the cerebral cortex. FDG uptake values (%ID/g) in the cerebral cortex are normalized to FDG uptake in muscle. Graph depicts mean values ± standard deviation of the cortex:muscle ratio in 5 min increments. (C) Rate of glucose uptake over the time-span of the 60 min scan. Values represent the mean slopes ± standard error of the best-fit lines derived from B (***p < 0.001, analysis of covariance, n = 5-7).