
Figure 3.
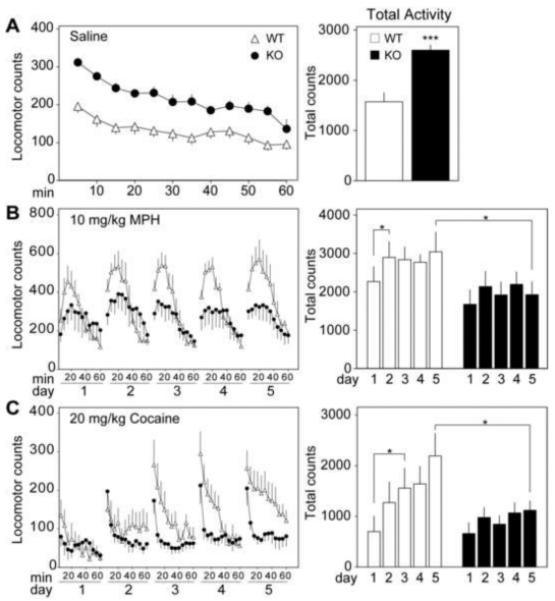
p35 knockout induces a locomotor profile reminiscent of ADHD. (A) Time course of the locomotor response to saline injection in control and p35−/− mice. Mean locomotor counts ± standard error for the 60 min following saline injection are shown (left). Each time point represents the average sum of locomotor counts from the previous five minutes, with the first point depicting 5 minutes of post-injection activity. Total locomotor counts ± standard error over the 60 min are also depicted (right) (***p < 0.001, Student’s unpaired t test, n = 5-7). (B) Time course of the locomotor response to chronic administration of methylphenidate (MPH, 10 mg/kg). Graph on the left shows mean locomotor counts ± standard error for 60 min intervals over a period of 5 days. Histogram at the right depicts total activity for each day ± standard error for the first 30 min of each session (*p < 0.05, Student’s paired t test, n = 5). (C) Time course of the locomotor response to chronic cocaine (20 mg/kg). Graph on the left shows mean locomotor counts ± standard error for 60 min intervals over a period of 5 days. Histogram at the right depicts total activity for each day ± standard error (*p < 0.05, Student’s unpaired t test, n = 5-7).