
Figure 2. Kaplan-Meier analyses of PGRN using best cut-off value defined by the ROC curve.
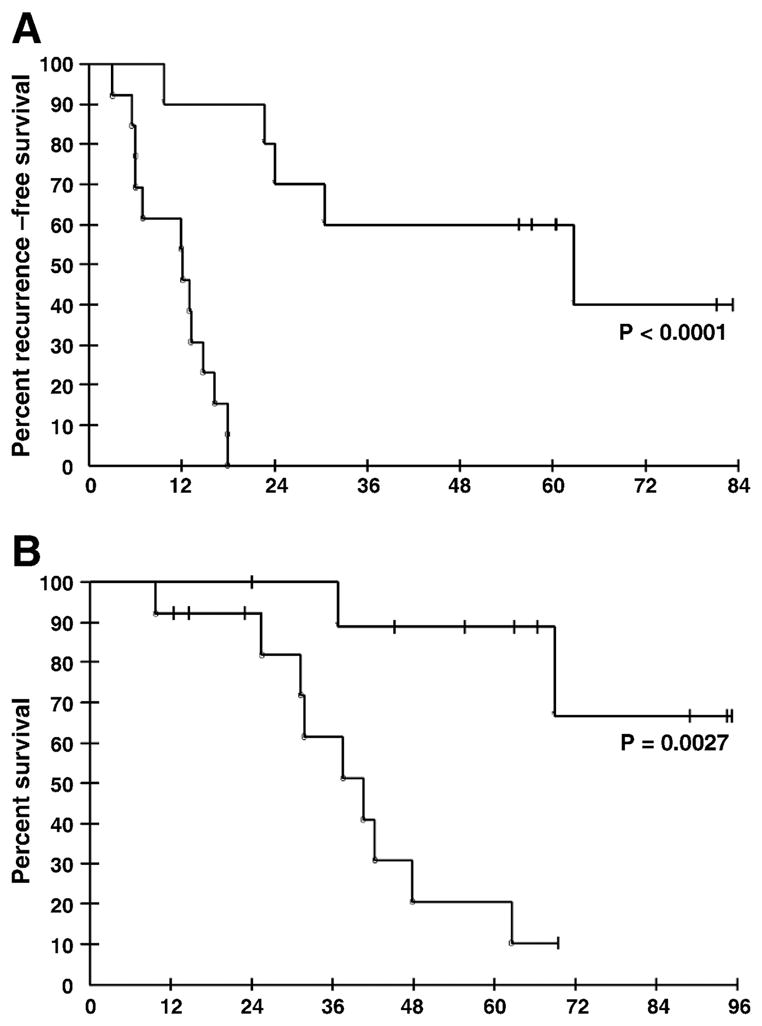
A. PFS according to PGRN concentration at 3 months. The PFS for the PGRN high group was 12 months and PGRN low group was 46.5 months. B. OS according to PGRN concentrations at 3 months.