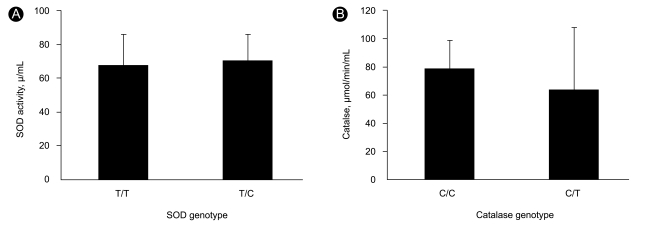
Figure 2.
Comparison of superoxide dismutase (SOD) and catalase activity according to genotype. (A) There were no significant differences in SOD activity between the T/T and T/C polymorphism (p = 0.774). (B) There were no significant difference in catalase activity between the C/C and C/T polymorphism (p = 0.479).

