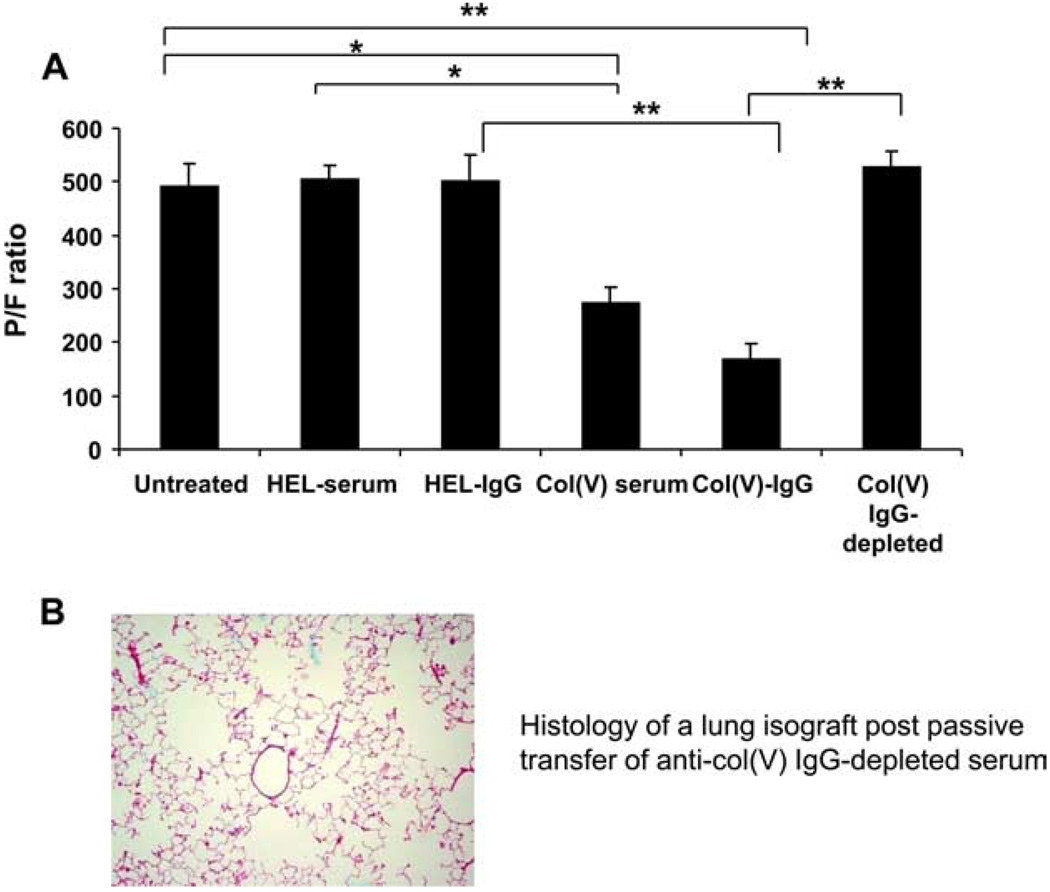
FIGURE 4.
PaO2/FIO2 as a function of treatment groups. A, Ratio determined as reported in Materials and Methods for untreated (normal) WKY rats and WKY isograft recipients posttransfer of serum or purified IgG. Data represent mean ± SEM of n = 3–4 rats in each group. *, p < 0.01 and **, p < 0.001. B, Histology of isograft lungs posttransfer of purified IgG depleted of anti-col(V) Abs. Data are representative of n = 3 rats per group. magnification with H&E stain is ×20.

