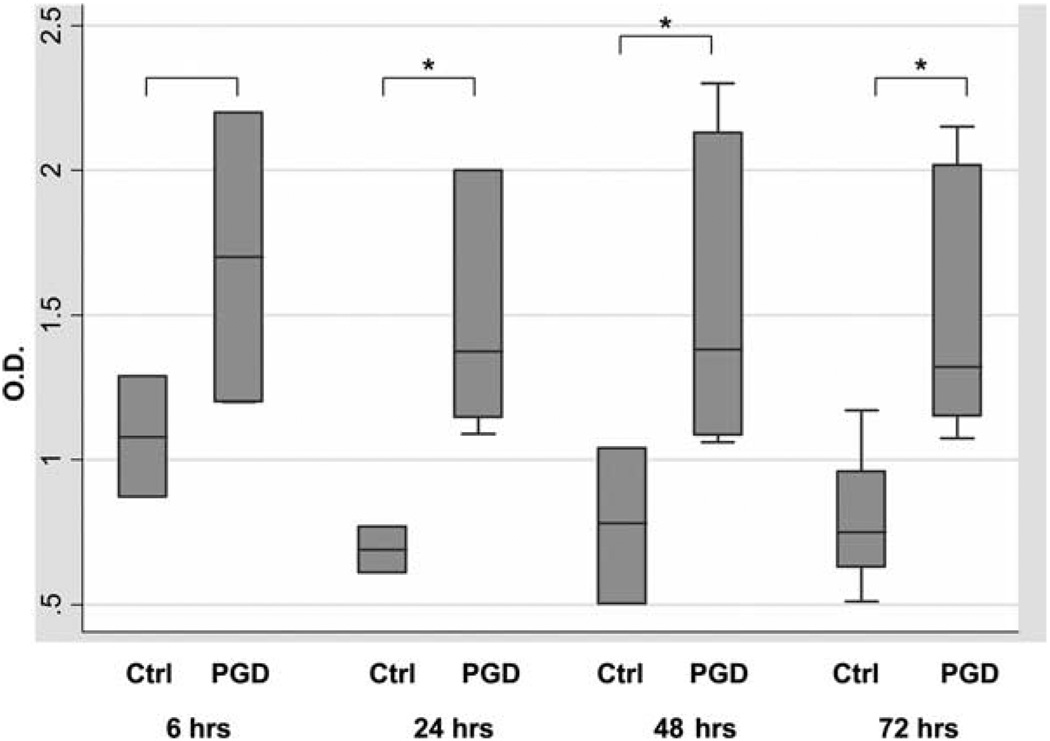
FIGURE 9.
Circulating Ab levels in patients with PGD and in non-PGD controls during the first 3 days after lung transplant. Box plots represent medians with intraquartile ranges, with whiskers representing full ranges. *, p ≤ 0.05 for the comparison at each time point between PGD and non-PGD. p < 0.001 for comparisons across all time points.

