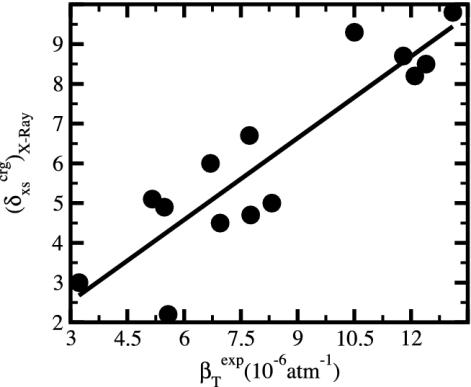
Fig. 3.
The excess charge,  , versus protein experimental isothermal compressibility, βTexp, for a set of 14 globular proteins. Values for
  were calculated from coordinates taken from the Protein Data Bank. Compressibility data are from Gekko and Hasegawa (19).

