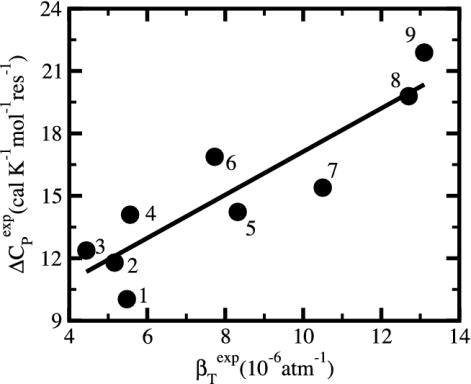
Fig. 4.
The change on unfolding in protein heat capacity per residue, ΔCP, versus the native-state isothermal compressibility, βTexp. Values are for measurements at 25°C and near pH 7. Data are computed from tables in refs. 36 and 41. The proteins are as follows: 1, ribonuclease A; 2, trypsin; 3, BPTI; 4, trypsinogen; 5, chymotrypsin; 6, lysozyme; 7, carbonic anhydrase; 8, pepsin; 9, myoglobin.

