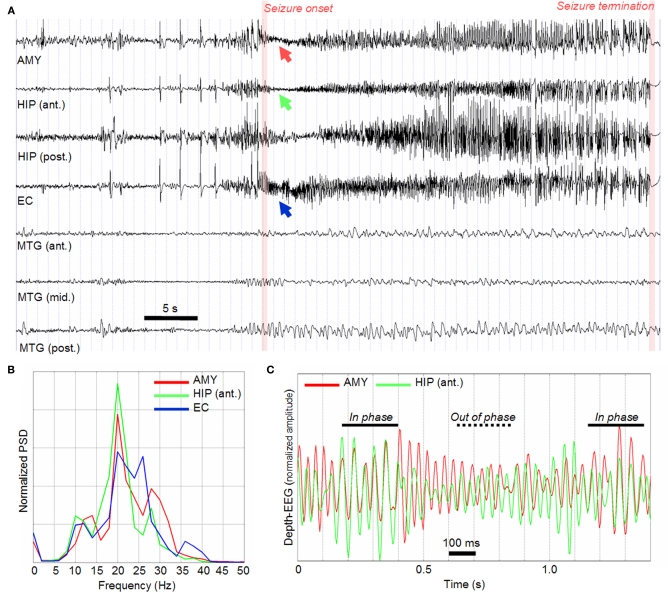
Figure 3.
(A) Example of SEEG recording (bipolar signals) performed during transition to seizure activity. Only signals recorded from mesial (AMY, HIP, EC) and lateral (MTG) structures in the temporal lobe are represented. AMY, amygdala; HIP (ant.), anterior part of hippocampus; HIP (post.), posterior part of hippocampus; EC, entorhinal cortex; MTG (ant., mid., post.), middle temporal gyrus from anterior to posterior part). (B) Normalized power spectral density (PSD) computed on the segment of SEEG signal corresponding to seizure onset and where a fast activity (about 25 Hz) is observed. (C) A zoom on the fast onset activity showing that a jitter is present: as time goes on, signals are either in phase or out of phase.

