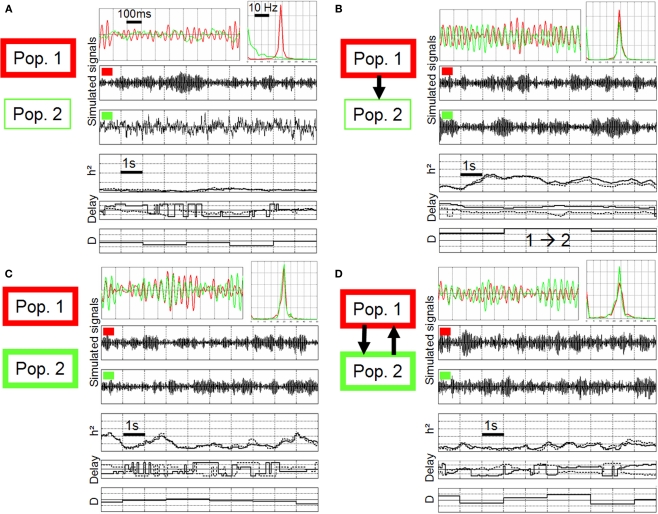
Figure 5.
Non-linear regression analysis applied on simulated signals, using the same method settings compared to Figure 4. (A) Different scenarios were considered regarding the intrinsic excitability of neuronal populations (thin line: excitability increased, thick line: excitability more strongly increased) and regarding the connectivity (no coupling, unidirectional coupling, bidirectional coupling). (B–D): both populations generate a fast activity (about 25 Hz) and a jitter is observed between simulated signals (red vs. green) as in real signals. Note that the behavior of non-linear regression analysis (h2 coefficient, time delays, direction index D) depends on the modeled situation (see text for details).

