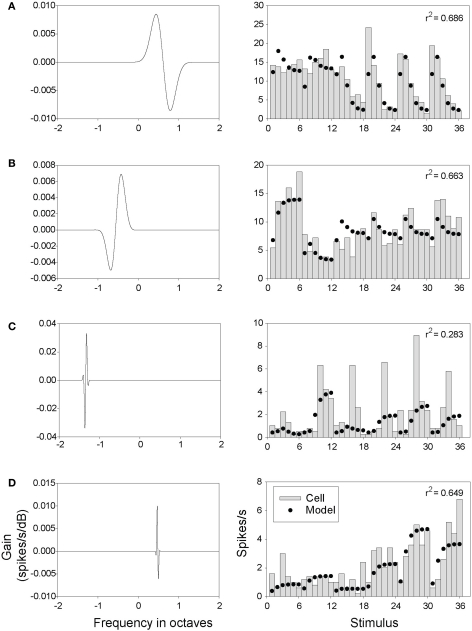
Figure 10.
Gabor model filters and outputs. Each row represents the results from a single neuron (A–D, left column). Each plot depicts a Gabor filter (weight vector) obtained for a single neuron using the optimization procedure used with Eq. 1 and the Gabor function as described in Section “Materials and Methods”. The gain of each filter is plotted as a function of frequency (A–D, right column). Model (•) and neural responses ( ) are plotted for each of the 36 spectral Gabor stimuli. Stimuli are ordered by bandwidth (0.25, 0.5,…,8 = 1, 2,…,6; 7, 8,…,12, etc.) embedded within ripple frequency (0.75 = 1–6, 1.75 = 7–12,…,17.25 = 31–36).

