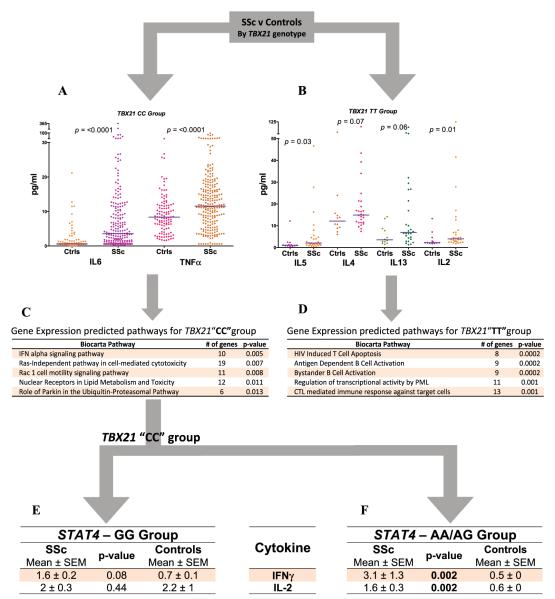
Figure 2.
A–D, Plasma cytokine levels (A and B) and gene expression predicted pathways (C and D)by TBX21 single-nucleotide polymorphism (SNP) group in systemic sclerosis (SSc) patients compared with healthy controls (Ctrls). Bars in A and B show the means. P values for gene expression predicted pathways were determined by Fisher’s least significant statistic after 100,000 permutations (http://cgap.nci.nih.gov/Pathways/BioCarta/). E and F, Gene expression predicted pathways by STAT4 SNP group in SSc patients compared with healthy controls. IL-6 = interleukin-6; TNFα = tumor necrosis factor α; IFN = interferon; HIV = human immunodeficiency virus; PML = promyelocytic leukemia; CTL = cytotoxic T lymphocyte.

