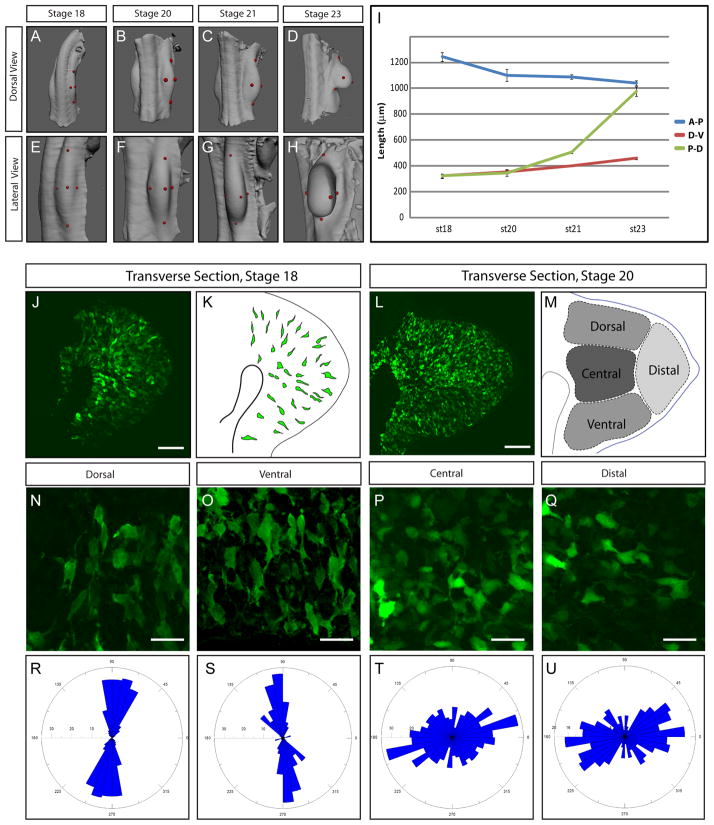
Figure 1. Characterization of Limb Bud Elongation at the Tissue and cellular Level.
(A–H) Three dimensional reconstructions of Optical Projection Tomography (OPT) acquisitions at the level of the limb bud of chick embryos at stages HH18 (A, E), 20 (B, F) 21 (C, G) and 23 (D, H) showing dorsal (A, B, C, D) and lateral views (E, F, G, H). The red dots show where the measurements were made, see Movie S1.
(I) Measurements of the length (in μM) of the antero-posterior (A-P, blue line), dorso-ventral (D-V, red line) and proximo-distal (P-D, green line) axes show that the limb bud elongates primarily in the P-D axis. A minimum of n=8 Limbs were analyzed for each time point, Error bars represent standard errors of the mean.
(J) Transverse section of an electroporated chick embryo at stage HH18 revealing the shape of GFP-expressing cells.
(K) Schematic representing the section shown in (D). A few GFP expressing cells have been outlined to show their orientation and elongated shape.
(L) Transverse section of an electroporated embryo at stage 20 showing the shape of GFP expressing cells (in green).
(M) Schematic representing four regions (dorsal, ventral, central and distal) of the section shown in (L).
(N–Q) Enlargements of the dorsal (N), ventral (O), central (P) and distal (Q) limb bud regions of a chick embryo at stage HH21 embryos showing the shape of the GFP-expressing cells.
(R–U) Quantification of the angle between the P-D axis of the limb bud and the longest axis of GFP expressing cell observed in the dorsal (R), ventral (S), central (T)_ and distal (U) regions at stage HH21. Angle of each cell longest axis is shown on a bidirectional Rosette graph which is divided into bins of 5°. The number of cells per bin is indicated on the radial axis. Quantifications were made on a total number of n=1468 cells with a minimum of n=300 cells for each area. Scale Bars in the lower right corner represent 50 μm (J, L) and 20 μm (R–U)

