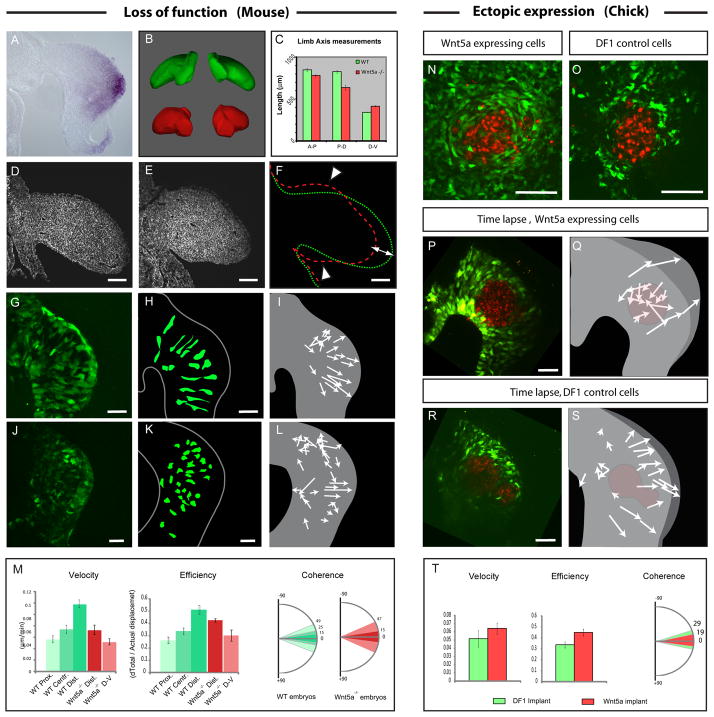
Figure 3. Wn5a regulates limb bud elongation and cell orientation in the mouse.
(A) Wnt5a expression detected by in situ hybridization showing higher expression in the distal mesenchyme of the early limb bud.
(B) Wild Type (WT) (green) and Wnt5a−/− mutant limb buds (red) reconstructed and virtually dissected from Optical Projection Tomography acquisitions of E10.5 Mouse embryo. Wnt5a−/− limbs exhibit elongation defects and appear roundish as compared to control. (See Movie S4)
(C) Measurements (in μM) of the A-P (left bars), D-V (central bars) and P-D (right bars) axes lengths in WT (green bars) and Wnt5a−/− (red bars) embryos.
(D–E) Transverse sections of WT (D) and Wnt5a−/− (E) mouse embryos at E10.5 stained with Phalloidin (in white).
(F) Outline of the WT (in green) and Wnt5a−/− (in red) limb buds shown in (D) and (E), respectively, showing the effect of the loss of Wnt5a on the relative proportions of the limb bud (i.e., A-P axis, white arrowheads and P-D axis (white arrow)).
(G, J) Transverse sections of WT GFP X+/− (G) and Wnt5a−/−; XGFP+/− (J) mouse embryos at E9.25 showing the shape of GFP expressing cells.
(H, K) Schematics representing outlines of GFP expressing cells from sections shown in (G) and (J).
(I, L) Schematics showing the net movement (arrows lengths) and the direction (arrowheads) of cells during time lapse experiments performed in WT GFP X+/− (I) and Wnt5a−/−; XGFP+/− (L) mouse embryos at E9.25 (Movie S5).
(M) Quantification of cell velocity (first panel), efficiency, (second panel) and coherence (third panel) in the proximal, central and distal regions of WT mouse limb bud (represented by shades of green, as schematized in the first panel of Figure 2D) and in the most distal and dorsal/ventral parts of Wnt5a −/− mouse limb buds ( dark red and light red respectively).
(N–O) Transverse section of chick limb buds electroporated with a GFP construct (in green) and implanted with control (O) or cWnt5a-expressing (N) DF1 cells stained with DiI (in red).
(P, R) First time series (t=0) from time lapse experiments (Movie S6) showing control DF1 cells (R) or cWnt5a-expressing cells (P, in red) implanted in limb buds previously electroporated with a GFP construct (in green).
(Q, S) Schematics showing the net movement (arrows lengths) and direction (arrowheads) of GFP-expressing cells from (P) and (R). GFP-expressing cells move toward the source of Wnt5a in (Q), and normally, towards the ectoderm in (S). The position of control DF1 cells (S) and Wnt5a-expressing cells (Q) is indicated in red. (see Movie S6).
(T) Quantification of cell velocity (first panel), efficiency, (second panel) and coherence (third panel) of GFP labeled cells surrounding implanted DF1 cells (in green) or Wnt5a expressing cells (in red). Scale Bars in the lower right corner represent 50 μm.

