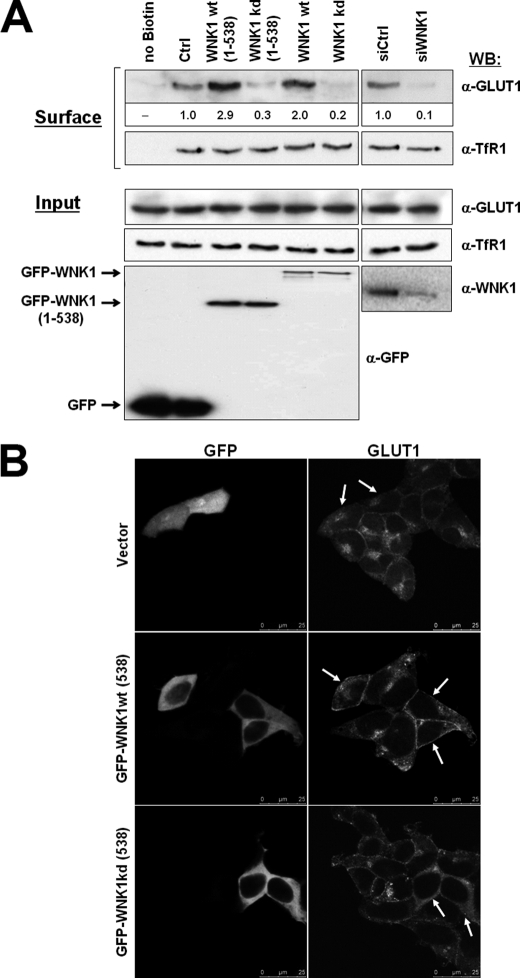
FIGURE 5.
Expression of WNK1 affects the amount of GLUT1 expressed at the cell surface. A, HEK293 cells were transfected as indicated with either GFP empty vector (Ctrl), full-length GFP-WNK1, fragment GFP-WNK1(1–538), or the respective kinase-dead mutants, as indicated. In separate experiments, HEK293 cells were transfected with either control (siCtrl) or WNK1-specific (siWNK1) small interfering oligonucleotides. Following 20 h cell surface proteins were biotinylated and captured from the cell lysate using streptavidin beads. Shown are Western blots (WB) detecting GLUT1 or transferrin receptor TfR1 in the biotinylated protein fraction (top panels, Surface). The corresponding quantification of GLUT1 band intensities is given as fold over control values below the blot. Shown also are the expression levels in whole cell lysates (Input) of endogenous GLUT1 and TfR1 (middle panels) and of GFP-tagged proteins or endogenous WNK1 (bottom panels). Note that GLUT1 surface levels increase upon expression of catalytically active WNK1 but decrease in WNK1-depleted cells, whereas surface levels of TfR1 remained unaffected. B, visualization of endogenous GLUT1 protein by immunofluorescence microscopy. HEK293 cells were transfected as indicated with GFP empty vector, GFP-WNK1(1–538), or the respective kinase-dead mutant. Cells were fixed after 16 h of expression, stained with anti-GLUT1 followed by a secondary Alexa 532-conjugated antibody and images were recorded on a Leica SPE confocal microscope. Transfected cells are marked by white arrows. Note the increased surface staining of GLUT1 in cells expressing WNK1 in contrast to increased intracellular GLUT1 staining upon expression of kinase-dead WNK1.

