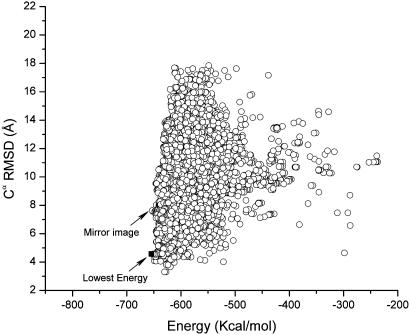
Fig. 2.
Cα RMSD vs. the total energy, computed by Eq. 1 using the OONS solvation model, for each of the accepted conformations obtained during runs 3 and 4. The scatter plot does not include those conformations obtained after the crosscheck (run 6). The mirror image (–652.9 kcal/mol) of the native fold identified in the figure belongs to the lowest-energy found in runs 3 and 4. However, this conformation is higher in energy than those obtained after the crosschecking test in run 6 (–654.3 kcal/mol); the conformation in run 6 belongs to the native-like fold and is indicated by a filled square in the figure and represents the lowest-energy conformation identified in all the runs carried out with the OONS solvation model, namely, runs 3, 4, and 6.

