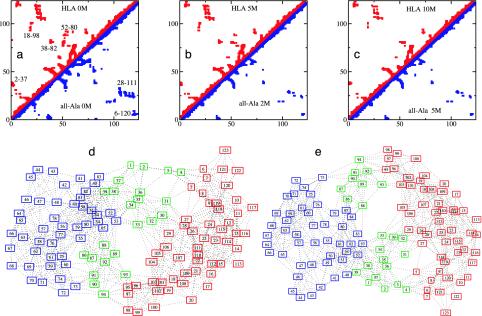
Fig. 3.
(a–c) Comparison between the average contact maps of HLA and all-Ala. (a) HLA and all-Ala at 0 M urea. (b) HLA at 5 M urea and all-Ala at 2 M urea. (c) HLA at 10 M urea and all-Ala at 5 M urea. Contacts with occupation probability >0.3 are shown. Clusters of contacts (labeled in a) in the regions of the WT long-range disulfide bonds 6–120 and 28–111 are visible also in the all-Ala protein. Other long-range clusters, including 2–37, 18–98, 38–82, and 52–80, are indicated. (d and e) Comparison of the graphs for HLA and all-Ala at 0 M urea, showing the modular assembly of the fold of both proteins. Each node of the graph represents an amino acid residue and each link represents a contact present with probability >0.3 in the ensemble of structures. The α core (residues 5–29 and 95–123) is in red, the β core (residues 40–85) is in blue, and the interface (residues 1–4, 30–39, and 86–94) is in green.

