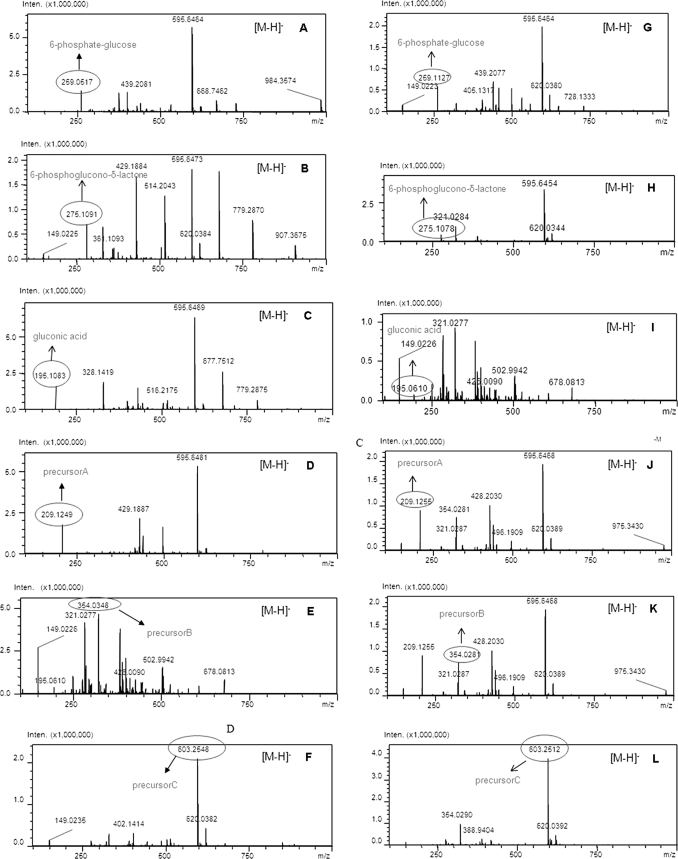
FIGURE 5.
Intracellular metabolites produced in strain CT-43 and thuE− mutant BMB0545 detected by LCMS-IT-TOF. A–F, the LCMS-IT-TOF profile of strain CT-43. G–L, the LCMS-IT-TOF profile of thuE− mutant BMB0545. Each intracellular metabolite is indicated (m/z values are shown). Inten., ion signal strength detected by the detector.

