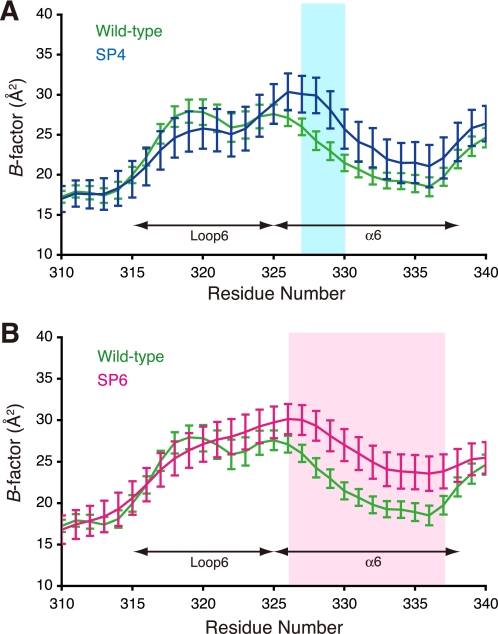
FIGURE 5.
Comparison of the B-factors. Each data point represents the adjusted B-factor of each Cα atom ± S.E. The B-factor values for the wild-type Tk-Rubisco as well as the mutants SP4 (A) and SP6 (B) are shown in green, blue, and red, respectively. The apparent differences between the wild-type data and the data for each mutant are shown in the colored regions (SP4, light blue; SP6, pink).

