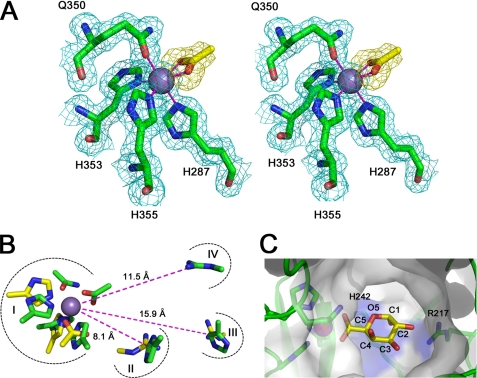
FIGURE 4.
The active site of YeOGL. A, the octahedral metal binding site is displayed in wall-eyed stereo format with the weighted maximum likelihood (20)/σA (53) 2Fo − Fc map (cyan) contoured to 1.0 σ (0.43 e−/Å3). The coordinated acetate ion (yellow sticks) is shown with an Fo − Fc omit map, produced from phases generated during refinements with the acetate molecule excluded from the model, contoured at 2.5 σ (0.18 e−/Å3). This map demonstrates the high quality of unbiased electron density for this molecule. The three histidines (His287, His353, and His355) and glutamine (Gln350) are shown in stick representation, and the Mn2+ ion is modeled as a sphere. B, superimposition of catalytic substructures within the active site of YePL2A (yellow, Protein Data Bank entry 2V8J) and YeOGL (green). Four aligned regions are shown: metal coordination pocket (I), catalytic base (II), and potential residues involved in substrate stabilization (III and IV). Distances of the residues from the metal are labeled. C, cut-away surface representation of the active site with a GalA modeled in the +1 subsite. The GalA uronate group of the aglycone is superimposed with the coordinated acetate ion with the axial H5 pointing toward the candidate Brønstead base His242 and O2 pointing toward the stabilizing Arg217, and O4 is presented for polymerization.

