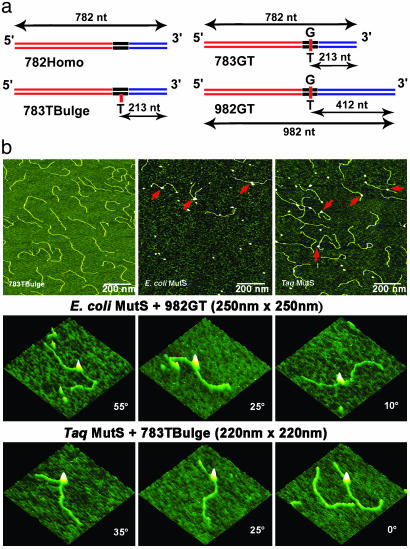
Fig. 1.
Schematic view of the DNA substrates used in this AFM study and AFM images of free DNA and MutS–DNA complexes. (a) The name of the DNA fragment is shown below each diagram. The length of the fragments and the position of the mismatch in nucleotides from the nearest end are shown by the black arrows. The two flanking fragments (red and blue) are made from the DraIII- and BglI-digested PCR fragments amplified from M13mp18 and pUC18 plasmids, respectively. The middle fragments (black) with the mismatches are generated by annealing two synthesized oligos. (b Top) AFM images of free 783TBulge heteroduplex DNA (Left), E. coli MutS–982GT complexes (Center), and Taq MutS–783TBulge complexes (Right). The red arrows point to MutS–DNA complexes. (b Middle and Bottom) AFM surface plots of E. coli MutS bound to a G/T mismatch and Taq MutS bound to a 1T-bulge, respectively. MutS-induced DNA bend angles are shown on each image.

