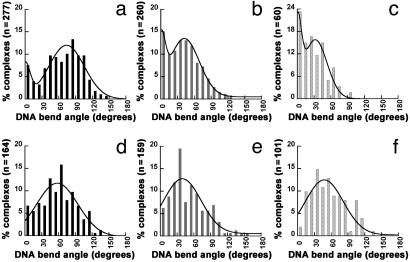
Fig. 3.
Histograms of DNA bend angles induced by E. coli and Taq MutS bound to mismatch (specific complexes, Upper) and homoduplex (nonspecific complexes, Lower) sites. DNA bend angles of specific complexes are shown for E. coli MutS bound at a G/T mismatch on the 783GT and 982GT DNA substrates (a) and for Taq MutS bound at a 1T-bulge on the 783TBulge substrate at room temperature (b) and at 65°C(c). DNA bend angles of nonspecific complexes are shown for E. coli MutS bound at homoduplex sites on 783GT and 982GT DNA substrates (d) and Taq MutS bound at homoduplex sites on 783Tbulge DNA substrate at room temperature (e) and at 65°C(f). The curves drawn in a–c are the double Gaussian fits to the data, and the curves drawn in d–f are the single Gaussian fits to the data. The parameters from these fits are shown in Table 1. A binomial analysis shows no peak at 0° for either E. coli or Taq MutS at homoduplex sites. In addition, fitting the curves of the bend angle distributions at homoduplex sites to a sum of two Gaussians does not significantly improve the fits. Because the data for MutS-induced DNA bending at homoduplex sites and at mismatch sites are obtained from the same depositions, the possibility that the differences seen at mismatch sites and homoduplex sites are artifacts of deposition is ruled out. See Figs. 6b and 8 for additional results on nonspecific complexes.

