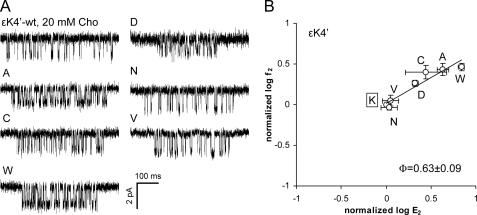
FIGURE 4.
Mutations of ϵLys4′ (ϵLys219) modestly increase the gating equilibrium constant. A, example clusters activated by 20 mm choline (Cho). B, R/E analysis. Each point represents the average of three patches with its S.D. (Table 2). The WT is boxed. The Φ-value (lower right) was estimated as the linear slope of log f2 versus log E2.

