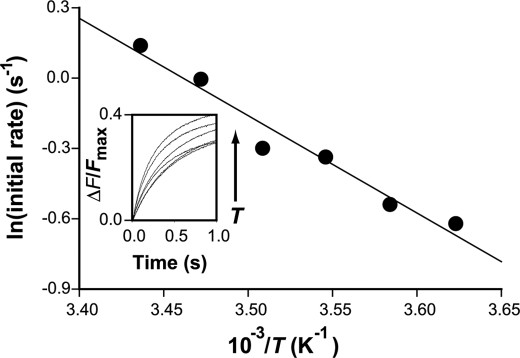
FIGURE 5.
Arrhenius plot of zinc fluxes at 3, 6, 9, 12, 15, and 18 °C. x axis, the reciprocal of temperature; y axis, the initial rate of zinc flux on a logarithmical scale. The solid line represents a linear regression of the temperature dependence. Inset, FluoZin-1 traces (ΔFZn/Fmax) recorded as a function of time at various temperatures.

