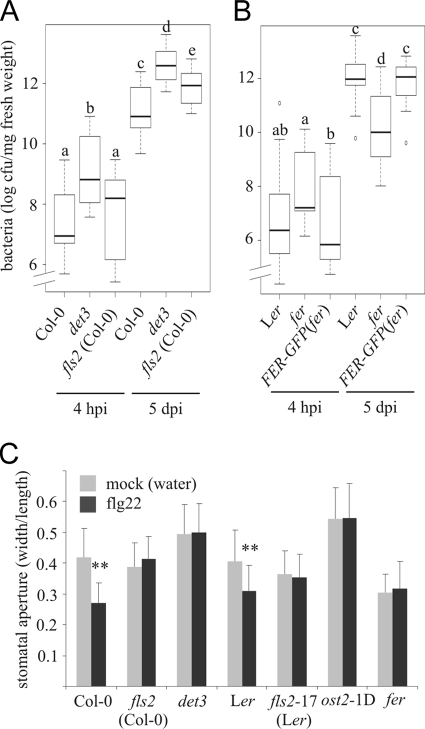
FIGURE 6.
det3 is hypersusceptible to bacterial infection and fer displays reduced bacterial proliferation. Arabidopsis det3 and fls2 (A), fer and FER-GFP(fer) (B) as well as respective wild-type plants were challenged with PtoDC3000ΔavrPtoΔavrPtoB. Depicted are box-plot diagrams representing the statistical distribution of the data. Statistical analysis (ANOVA and subsequent post-hoc test by Tukey's HSD) was done using R software. Thick lines indicate the median, boxes designate the interquartile range, whiskers specify the whole data range, and dots represent outliers. A, experiment was repeated three times, the box plot summarizes three representative data sets. B, experiment was repeated twice, the box plot includes all three data sets. Letters indicate significant differences at the level of p < 0.05. C, stomatal aperture in first true leaves of 2-week-old seedlings was determined following mock or flg22 treatment (3 μm, 2 h) as the ratio of the width to length of 20–63 stomata per genotype. Asterisks indicate a statistically significant difference (p < 0.01) between mock and flg22 treatment (Student's t test). The experiment was repeated once with similar results.

