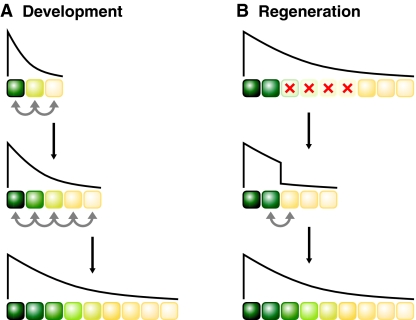
Fig. 3.
The polar coordinate model and Hippo signaling during organ growth. (A,B) Schematics representing the polar coordinate model to explain growth during (A) normal development and (B) regeneration. The schematics depict cells in growing tissues; the graded colors and the gradient lines indicate gradients of positional information or Dachsous (Ds) activity. When the difference of positional information between two neighboring cells exceeds a certain threshold, this triggers cell proliferation at the position of discontinuity (gray arrows) followed by intercalation of intermediate values. This `boundary effect' will drive proliferation until the gradient of positional information or Ds activity is smooth and differences between neighboring cells are below the threshold. (A) During development, gradients of positional information are steep initially, triggering intercalary proliferation until the tissue has reached its proper size and gradient of positional information. (B) During regeneration, after some cells are ablated (red crosses), cells at the wound site are juxtaposed to cells with inappropriate positional values (gray arrow), which triggers intercalary proliferation until the normal situation is restored. Ds activity is graded in developing Drosophila imaginal discs, reflecting positional information, and differences in Ds activity between neighboring cells can suppress the Hippo pathway and trigger proliferation (Rogulja et al., 2008; Willecke et al., 2008).

