Fig. 2.
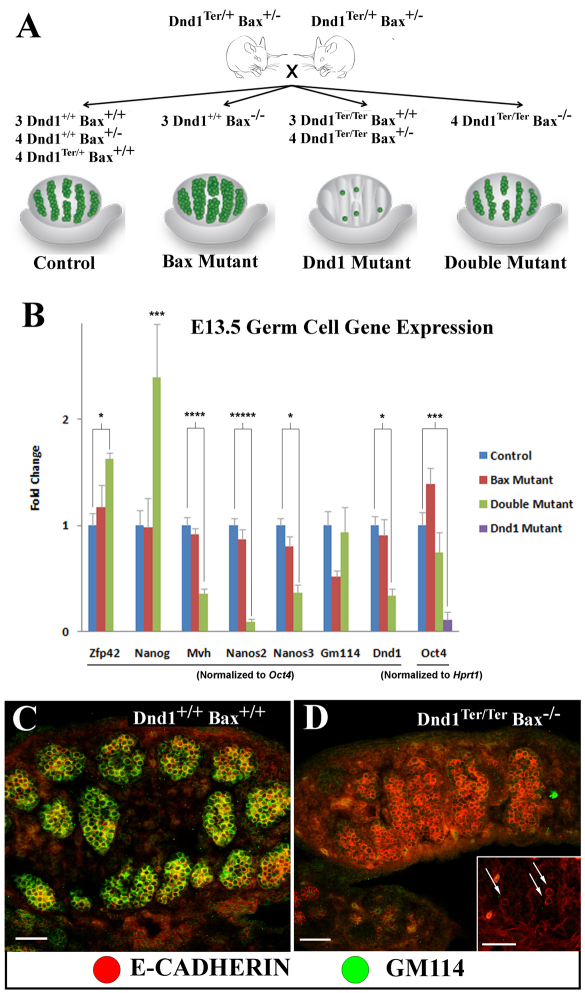
Germ cell markers change at the transcriptional and post-transcriptional levels in E13.5 mutant germ cells. (A) Schematic representation of germ cell numbers in tissue collected for qRT-PCR analysis. The numeral indicates the number of pairs of gonads for each genotype collected. (B) Oct4 expression levels are consistent with germ cell number estimates by immunofluorescence as previously published [see cartoon in A and Cook et al. (Cook et al., 2009)]. Double mutants express lower levels of Dnd1, show transcriptional upregulation of pluripotent markers (Zfp42 and Nanog) and a decrease in differentiation markers (Mvh, Nanos3 and Nanos2) compared with controls. Although there is no significant difference in Gm114 transcript levels in double mutants (B), antibodies against GM114 (green), which label wild-type germ cells (ECAD, red) at E13.5 (C), indicate that double-mutant germ cells fail to express GM114 protein (D) on a mixed background or in Dnd1Ter/Ter mutants on a 129/SvJ background (inset, arrows). Scale bars: 50 μm. In B, each bar represents the standard error of the mean (s.e.m.) of at least three biological replicates. *P<0.05; ***P<0.005; ****P<0.001; *****P<0.0005; ******P<0.0001.

