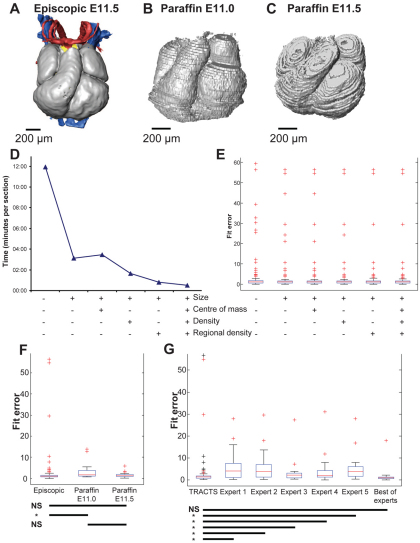
Fig. 3.
Validation of TRACTS. (A) The episcopic test model of stage E11.5 from which 95 virtual sections were taken and placed by TRACTS. (B,C) 3D reconstructions based on paraffin sections of E11.0 (B) and E11.5 (C) mouse embryos. Sections of these reconstructions were used to assess the performance of TRACTS on standard histological sections. (D) Computation time in the episcopic-episcopic test for different feature settings, when the feature is used (+) or not used (–). (E) Box plots showing the normalized fit error of TRACTS, using different feature settings. The red line denotes the median fit error and the blue box shows the interquartile range. Outliers (plus signs) are defined as more than 1.5 times the interquartile width around the interquartile range; the plotted whiskers extend to the most extreme data values that are not an outlier. (F) Box plots comparing the performance of TRACTS with the episcopic dataset and with sections of the two paraffin datasets. There was no significant difference between the performance on the E11.5 paraffin and the episcopic dataset, nor between the two paraffin sets, but there was a significant difference between its performance on the E11.0 paraffin and E11.5 episcopic datasets. NS, not significant; E11.5 paraffin-episcopic, P=0.191; E11.0 paraffin-episcopic, P<0.001; E11.5 paraffin-E11.0 paraffin, P=0.069. (G) Box plots comparing the performance of TRACTS with the result of each morphology expert and, for each section, the best-fit result of any of the experts (`best of experts'). The black plus signs in the TRACTS column indicate sections that were not included in the sample of 24 sections registered by the experts. The performance of TRACTS was significantly better than each individual expert but there was no significant difference between TRACTS and the `best of experts'.

