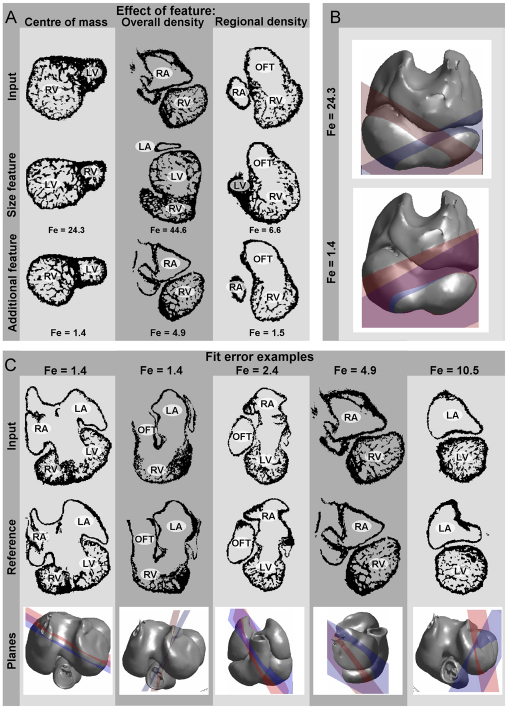
Fig. 4.
Effect of image features and interpretation of the fit error. (A) Added image features reduce misplacements. At the top, the test sections used as input images for TRACTS are shown. The middle row shows which reference sections were found using only a selection on heart size. The bottom row shows the reference section recovered when an additional feature is used. The normalized fit error (Fe) is given for each of the (mis)placed images. LA, left atrium; RA, left atrium; LV, left ventricle; RV, right ventricle. OFT, outflow tract. (B) Comparison of the fit errors with their corresponding planes based on the first lane of A. The blue planes are the input section and the red planes are the positions found by TRACTS, using the size constraint (top) or the center of mass constraint (bottom). (C) Examples to help with the interpretation of the normalized fit error. Lanes 1 and 2 show the translation and rotation resulting in a fit error of 1.4, which is close to the 75th percentile; 75% is fitted to positions that deviate less. Lanes 3, 4 and 5 show larger fit errors, although in all cases the correct compartments are recovered.

