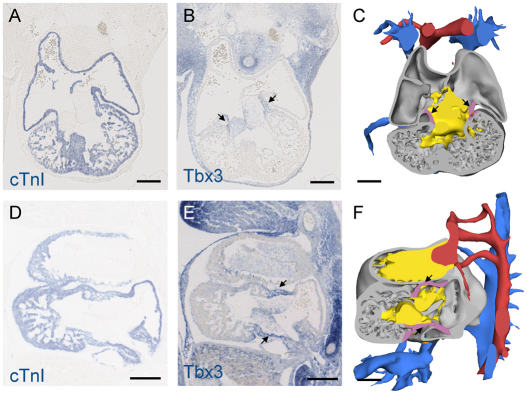
Fig. 6.
Biological application. (A,D) Sections from two different mouse embryos stained for the expression of cTnI. (B,E) Adjacent sections of A and D, respectively, stained to visualize Tbx3 expression. Arrows indicate Tbx3 expression. The cTnI-positive myocardium in these images was segmented to enable TRACTS to fit these sections into the reference model. (C,F) The fit locations found by TRACTS are shown in the reference mode; cranial (C) and left lateral (F) views are shown. For an interactive version, see Fig. S3 in the supplementary material. Scale bars: 200 μm.

