Figure 1.
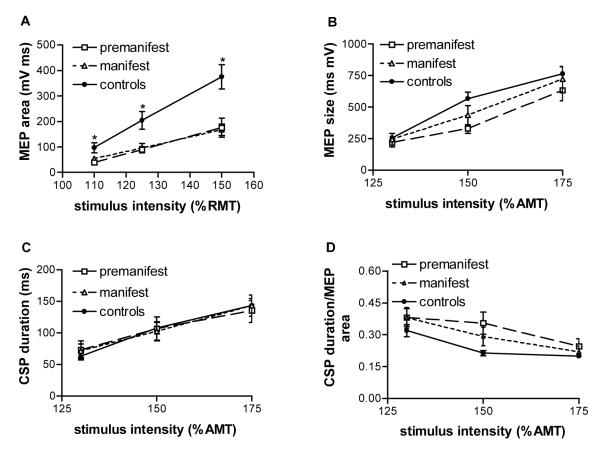
cortico-spinal system excitability. A. MEP size (area) recorded from relaxed FDI after TMS shock to the M1 hand area with 110%, 125% or 150% of RMT. Patients recruitment slopes were flatter than those of controls (repeated measures ANOVA, interaction ‘intensity*group’, F2,72=3.9, p=0.006). Post-hoc pairwise comparisons showed that the slope of both premanifest (0=0.013) and early manifest patients (p=0.017) was flatter than in controls whereas the slopes of both patient subgroups were similar. B-D. MEP size and CSP duration recorded from active FDI after TMS shock to the M1 hand area with 130%, 150% or 175% of AMT. MEP area (B), CSP duration (C) and the ratio of CSP duration and MEP area (D) are similar in controls and HD patients. Values are means ±SEM, n=16 for HD patients (n=8 premanifest, n=8 early manifest), n=22 for controls.

