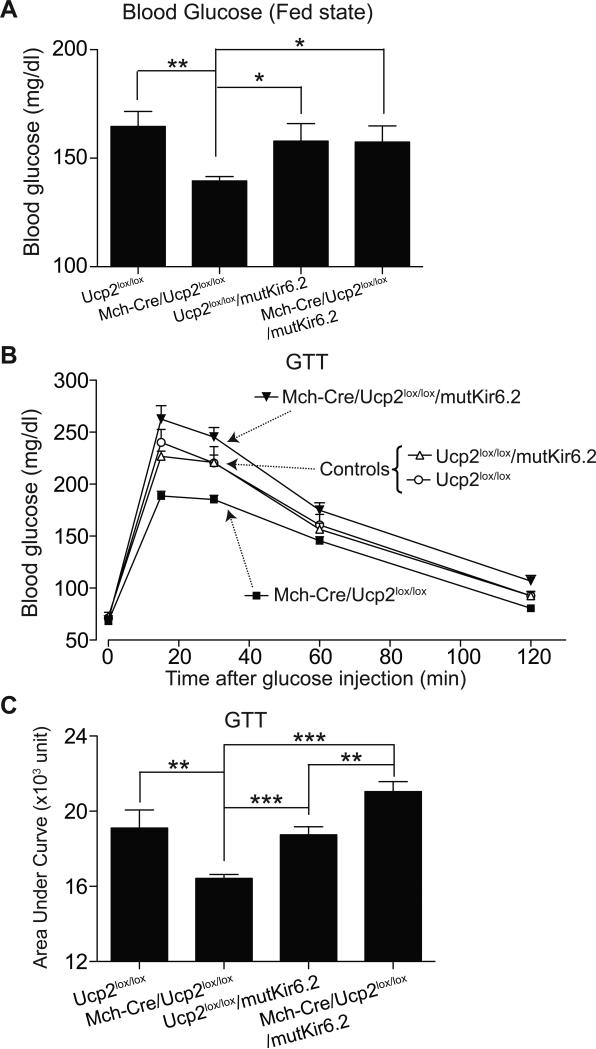
Figure 4. Mutant KATP Channels Block the Effects of UCP2-deficiency in MCH Neurons.
(A) Blood glucose levels of ad lib fed 8-week-old male mice (mean ± SEM, n=7-8 per genotype). Asterisk, P<0.05; Two asterisks, P<0.01, compared with littermates (one-way ANOVA assay). (B) Representative glucose tolerance curves of 8-week-old male mice (mean ± SEM, n=7-8 per genotype, 2 g/kg glucose i.p.). (C) GTT data from (B) expressed as Area Under the Curve. Asterisk, P<0.05; Two asterisks, P<0.01, Three asterisks, P<0.001, compared with littermates (one-way ANOVA assay).

