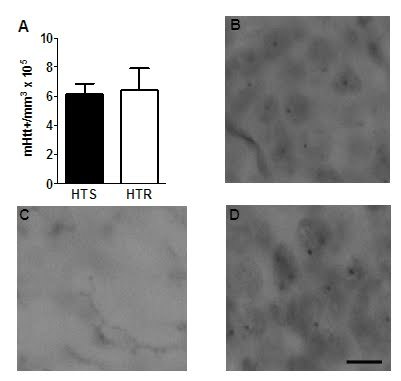
Figure 6. Running does not alter the number of DG cells with mHtt+ inclusions. (A) The number of cells with mHtt+ inclusions (mHtt+/mm3) does not differ between HTR and HTS mice. Data represents mean ± SEM (HTS=7; HTR=6). Representative photomicrograph showing hippocampal mHtt+ staining in HTR (B) WTS (C) HTS (D). Scale bar = 10µm.