
Figure 3.
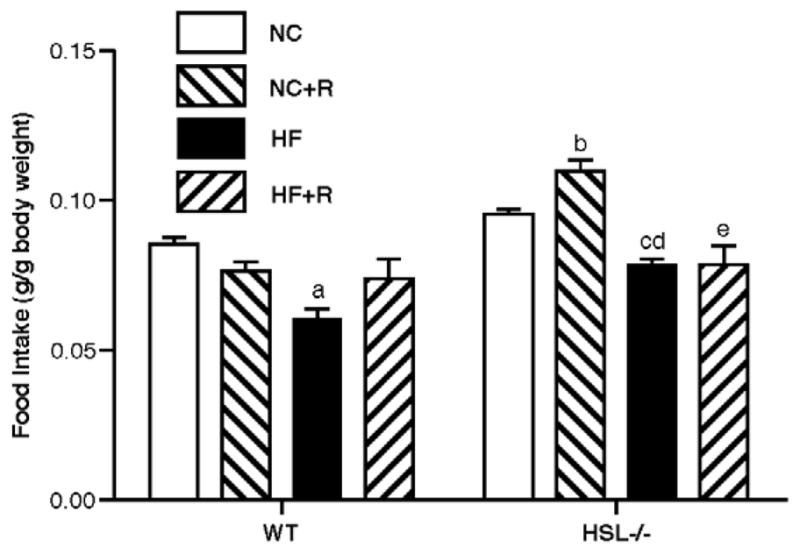
24 hour food consumption. Food consumption of the animals was measured over 24 hr periods, every other week on the various diets. Data shown are means ± SE (n=8 in each group). WT, wild type; NC, normal chow; HF, high fat diet; R, rosiglitazone. a, p<0.001 compared with WT NC; b, p<0.001 compared with WT NC+R; c, p<0.05 compared with −/− NC; d, p<0.05 compared with WT HF; e, p<0.001 compared with −/− NC+R.