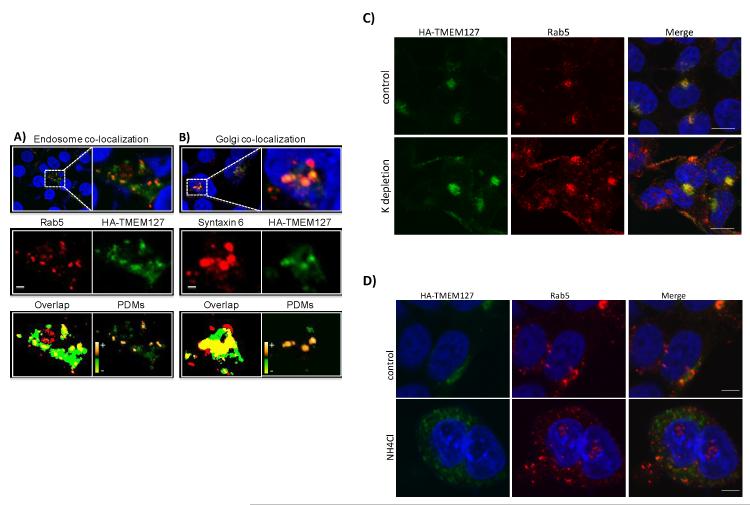
Fig. 2. TMEM127 colocalizes with multiple components of the endomembrane system.
Confocal images of HA-TMEM127-transfected HEK293E cells fixed and immunofluorescently labeled with either the early endosome marker Rab5 antibody [red, (A)] or the Golgi marker syntaxin 6 [red, (B), HA antibody (green) and DAPI (blue)]. Regions identified by the white-dashed rectangles are presented at higher magnification in the right and lower panels. Middle panels: separate presentations of the red and green channel images. Lower panels: overlap (yellow) of red and green pixels, irrespective of their intensity. Right image panel presents intensity values of the product of the difference of the means (PDMs). Positive PDMs identify pixels where intensities in the red and green channels vary in synchrony. Perfectly synchronous signals would be indicated with a PDM value of 1. Completely asynchronous signals would have a value of −1. The PDM intensity scale ranges from the minimum to maximum values within each image panel, −0.5 to 0.5 in A and −0.6 to 0.6 in B. Optical sections are ~0.4 μm thick. Bars are 2 μm. These results were representative of multiple cells assessed in independent experiments. C) HEK293E cells stably transfected with HA-TMEM127 were left untreated (top) or were cultured in the presence of a potassium-depleting buffer (bottom), as described in Methods. Cells were fixed and stained with antibodies specific for HA (green) or, Rab5 (red) before imaging. DAPI (blue) represents nuclei. An increase in plasma-membrane associated TMEM127 and control Rab5 is seen after inhibition of endocytosis promoted by this treatment. Bars are 10μm. D) HEK293E cells stably transfected with HA-TMEM127 were left untreated (top) or were exposed to 50mM ammonium chloride (bottom) for 2 h. Cells were fixed and stained with antibodies specific for HA (green) or Rab5 (red) before imaging. DAPI (blue) represents nuclei. Expansion of endosomal structures is seen both for HA-TMEM127 and Rab5. Bars are 5μm.

