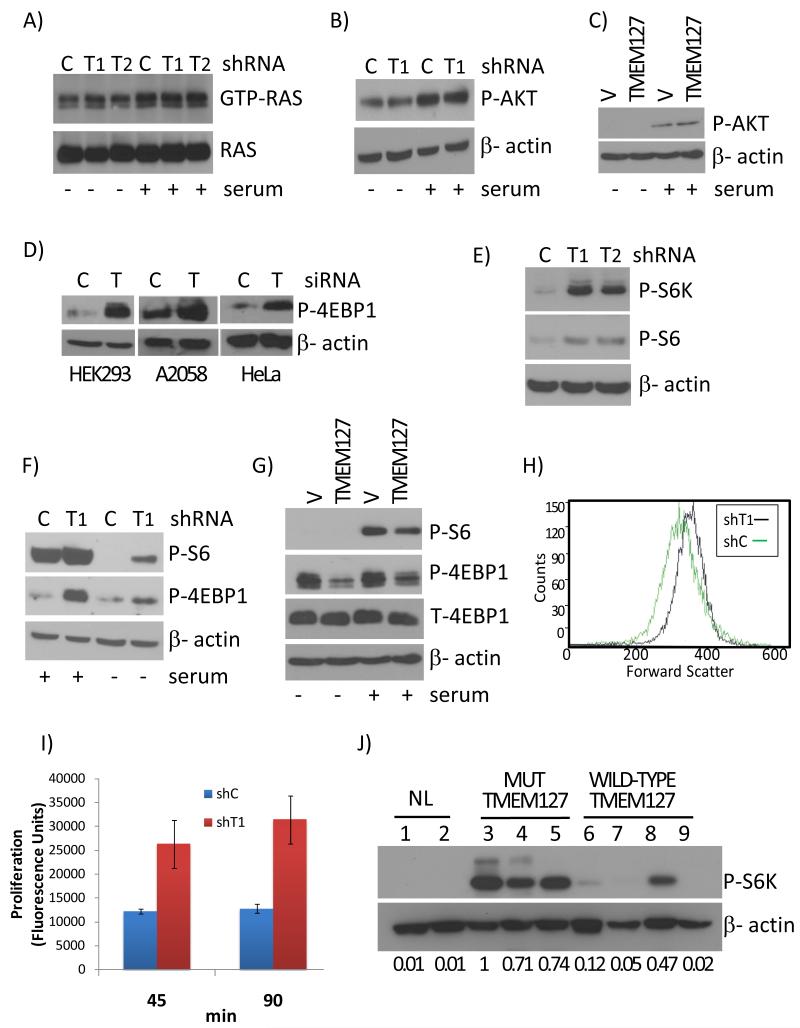
Fig.3. TMEM127 modulates mTORC1 signaling in vitro and in vivo.
A) RAS activation measured by a RAS pull down assay (RAS-GTP expression) of 293E cells with TMEM127 knockdown by two independent shRNA sequences( T1 and T2), or a control knockdown (C) in the absence or after 10 minutes of serum exposure. Total RAS is shown as sample loading control. Effectiveness of the serum treatment is shown in Suppl. Fig. 7A; B) AKT phosphorylation in TMEM127 (T1) or GFP (C) knockdown 293 cells in the presence or absence of serum; β-actin is a loading control; C) Phosphorylation of mTORC2 target AKT in 293E cells overexpressing HA-tagged TMEM127 (TMEM127) or an empty vector (V) in the presence or absence of serum. β-actin is a loading control; D) Effects of transient TMEM127 knockdown (T) on 4EBP1 phosphorylation in HEK293, A2058 and HeLa cells. C=GFP control knockdown. β-actin is a loading control; E) Phosphorylation of mTORC1 targets S6K and S6 in 293E cells depleted for TMEM127 by two independent shRNA sequences (T1 and T2); C=GFP control knockdown; F) Effects of TMEM127 knockdown (T1) on 4EBP1 and S6 phosphorylation in HEK293 in the presence or absence of 10% serum. C=GFP control knockdown; G) Phosphorylation of mTORC1 targets, as above, in 293E cells expressing HA-tagged TMEM127 (TMEM127) or a control HA-empty vector (V); T-4EBP1 = total 4EBP1. H) Forward scatter FACS analysis of TMEM127 (T1) or control (C) knockdown in HEK293 cells. Ungated results are displayed and are similar to profiles obtained at the G1 and G2 phases of the cell cycle. I) Proliferation of TMEM127 or control knockdown 293E cells measured at the indicated time points after serum addition in cells serum-starved overnight using a DNA-bound fluorescence assay(P<0.002, t-test). Error bars are ±SE of triplicate experiments J) Phosphorylation levels of S6K in pheochromocytoma lysates. Two normal adrenal medulla samples (lanes 1 and 2) were compared with tumor lysates from TMEM127 mutant (Mut TMEM127) samples (lanes 3, 4 and 5, corresponding to samples from family 5, 6 and 1, respectively) and four tumors with wild-type TMEM127 sequence (WT TMEM127), including two sporadic samples (lanes 6 and 7), one tumor from neurofibromatosis type 1 (lane 8) and one VHL-mutant tumor (lane 9). Densitometric measurements of the bands in relation to β-actin are displayed below each lane (lane 3 ratio was set to 1).

