
Figure 1. Induction of outward currents by ADP in PC12 cells stably expressing rat P2Y1 receptors.
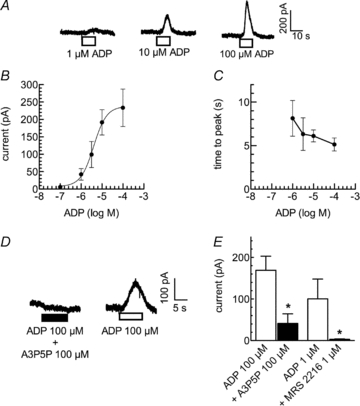
Cells were voltage clamped to −30 mV, and ADP was present for 10 s as indicated by the bars in A and D with washout periods of 10 min between the applications. A, original current traces. B, concentration–response curve for the peak amplitudes of outward currents induced by ADP (n= 16). The continuous line represents the least square fit of the data to a Hill equation with the following resulting parameters: log EC50−5.40 ± 0.06, nH 1.40 ± 0.24. C, concentration–response curve for the delay of peak outward currents induced by ADP (n= 16). D, ADP was first applied together with the specific P2Y1 antagonists A3P5P and then alone; original current traces are shown. E, ADP was first applied together with the specific P2Y1 antagonists A3P5P or MRS 2216 and then alone; peak amplitudes in either the presence or absence of A3P5P or MRS 2216 are depicted. *Significant difference at P < 0.05 (n= 5).