
Figure 4. ADP-induced rises in intracellular Ca2+ and activation of KCa2 channels.
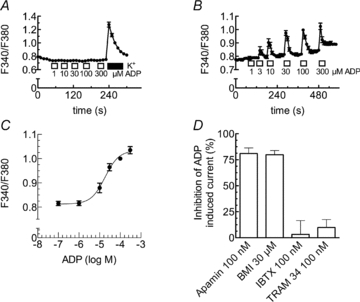
A–C, either untransfected (A) or PC12 cells stably expressing rP2Y1 receptors (B and C) were loaded with fura-2 AM and continuously superfused; ADP was applied as indicated by the bars. Changes in intracellular Ca2+ were evaluated by the changes in the ratio of fluorescence at 340 nm and 380 nm (F340/F380). A, changes in the ratio of fluorescence in untransfected PC12 cells due to the application of either the indicated ADP concentrations or 100 mm K+. B, changes in the ratio of fluorescence in PC12 cells stably expressing rP2Y1 receptors due to the application of the indicated ADP concentrations (n= 42). C, concentration–response curve for the maximal increase of intracellular Ca2+ caused by the indicated concentrations of ADP. Data points were fitted to a Hill equation using a non-linear least square algorithm; the fitted parameters are: log EC50=−4.74 ± 0.09, nH= 1.29 ± 0.38 (n= 42). D, PC12 cells stably expressing rP2Y1 receptors were voltage clamped to −30 mV, and currents evoked by ADP (100 μm) three times (I1, I2, I3) at 10 min intervals either under control conditions or in the presence of apamin (100 nm, n= 8), biccuculine methiodide (BMI, 30 μm, n= 8), iberiotoxin (IBTX, 100 nm, n= 10), or TRAM 34 (100 nm, n= 6). After the first 25 min, cells were exposed for 5 min to one of these channel blockers and ADP was applied again in the presence of these blockers. To assess the block of ADP induced currents by these drugs, the percentage of inhibition was calculated as 100 – 100 × ((I3/I2)/(I2/(I1)).