
Figure 5. Roles of P2Y1 receptors in the inhibition of Ca2+ currents by ADP.
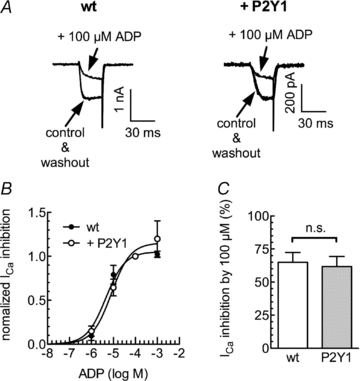
Either untransfected PC12 cells or PC12 cells stably expressing P2Y1 receptors were voltage clamped to −80 mV and depolarized to 0 mV for 30 ms once every 15 s in the presence of TEA (20 mm) and tetrodotoxin (500 nm). A, original current traces in wild-type (wt; left) or P2Y1 expressing (right) cells obtained before (control), during and after (washout) the application of ADP (100 μm). B, concentration–response curves for the inhibition of peak Ca2+ currents (ICa) by the indicated concentrations of ADP. Data points were fitted to a Hill equation yielding the following values for half maximal inhibition: log EC50: 5.34 ± 0.06 for wt cells of −5.09 ± 0.05 for P2Y1 expressing PC12 cells (R2= 0.99 each). C, inhibition of peak Ca2+ currents (ICa) by 100 μm ADP in wild type (wt) or P2Y1 expressing PC12 cells. n.s. indicates no significant difference, P > 0.1 (Mann–Whitney U test; n= 4–6).