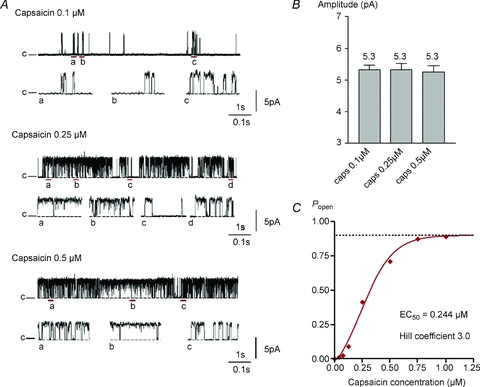
Figure 2. Characteristics of single TRPV1 channels.

A, dependence of hTRPV1 single-channel activity on capsaicin concentration (applied in pipette in cell-attached patch configuration). Traces show single-channel activity in response to different capsaicin concentrations (0.1 μm, 0.25 μm and 0.5 μm). c and the dashed line denote the closed level. Fragments of the trace underlined are shown on an expanded time scale below each representative trace for each concentration. B, mean single-channel amplitude ±s.e.m. Numbers of cells (from left) n= 11, 5, 5. C, dose–response curve obtained in a separate experiment with bath application of capsaicin. The EC50 for capsaicin is 0.244 μm, the maximum Popen is 0.900 and the Hill coefficient is 3.0.
