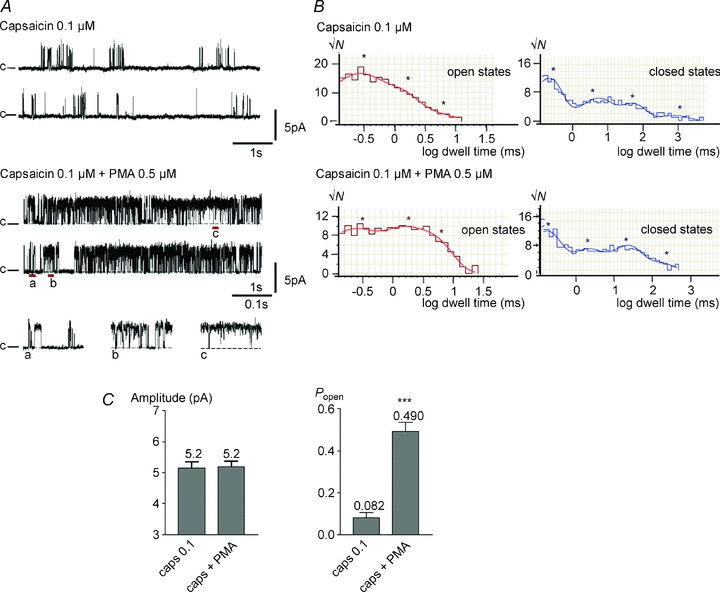
Figure 4. PMA (0.5 μm) potentiates capsaicin-induced single-channel activity.

A, representative traces of single-channel activity induced by 0.1 μm capsaicin and activity recorded from the same cell-attached patch after perfusing PMA. Short stretches are expanded below. B, dwell time distribution histograms of the open state (left), and the closed state (right) for activity induced by 0.1 μm capsaicin in the presence and absence of PMA as indicated on the graph. The fit is shown superimposed on the histograms and asterisks indicate the dwell times derived from fitting the dwell time distributions. C, bar graphs show mean amplitude ±s.e.m., and average open probability (Popen) ±s.e.m. for TRPV1 activity in response to 0.1 μm capsaicin in the presence and absence of PMA. Significance levels: ***P < 0.001.
