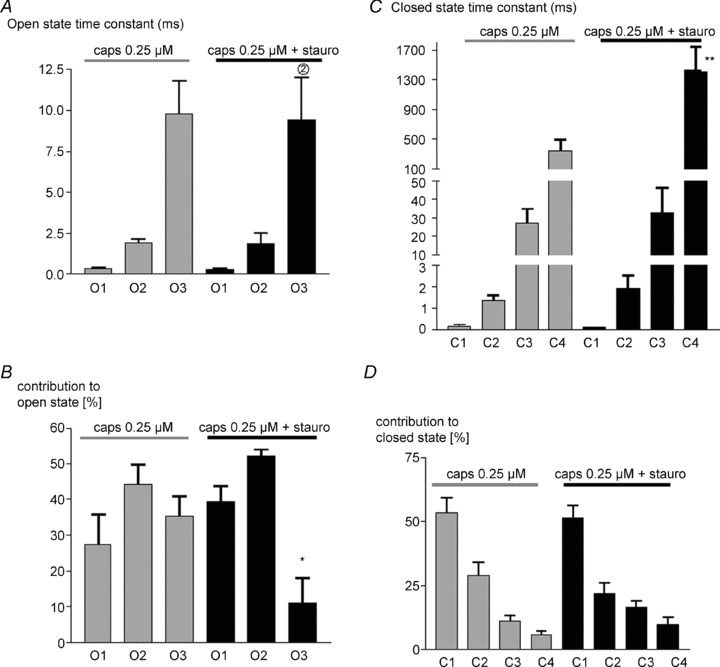
Figure 7. Staurosporine affects dwell time distribution of open and closed states.

A, mean open state time constants ±s.e.m. with 0.25 μm capsaicin alone, and with 0.25 μm capsaicin in presence of 0.2 μm staurosporine. B, mean percentage contribution of each open state to the total open time. C and D, similar graphs for closed dwell times. Significance levels: *P < 0.05, **P < 0.01with respect to values in absence of staurosporine.
