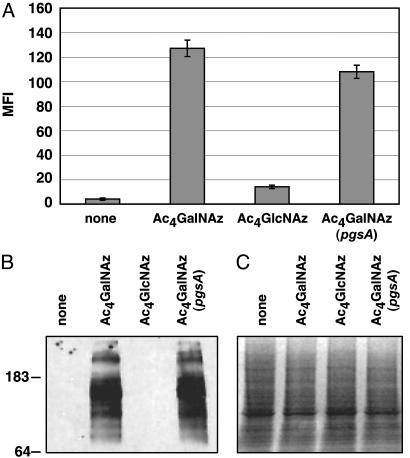
Fig. 4.
Evaluation of the metabolic fates of Ac4GalNAz and Ac4GlcNAz in CHO cells. (A) Cells were incubated with 50 μMAc4GalNAz or Ac4GlcNAz and analyzed by flow cytometry as in Fig. 3. MFI, mean fluorescence intensity in arbitrary units. Data points represent the average of duplicate experiments. Bars indicate high and low values. (B) α-FLAG Western blot analysis of cell lysates. After longer exposure times, faint labeling of glycoproteins is also observed from Ac4GlcNAz-treated cells. (C) Coomassie staining of the same gel as in B, demonstrating comparable levels of protein loading (≈50 μg per lane).

