
Figure 2.
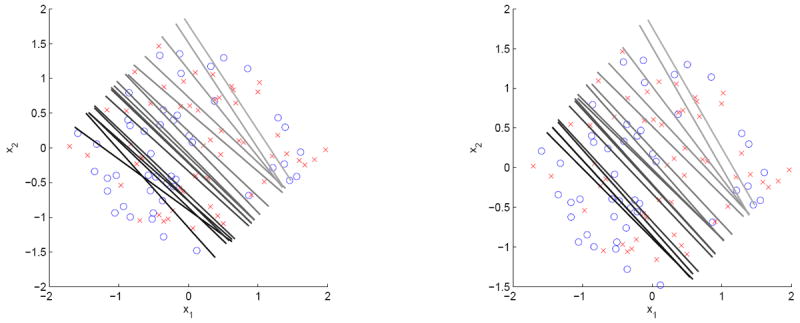
Estimated classification boundaries for different πk in a typical sample of Example 1 with π = 0.05, 0.06, 0.07, 0.08, 0.09, 0.10, 0.20, 0.30, 0.40, 0.50, 0.60, 0.70, 0.80, 0.90, 0.96, 0.97, 0.98, 0.99: Wang et al.’s method is in the left panel and our new non-crossing version is in the right panel.